I recently deployed a MIM 2016 solution into Production that took about 10 months to build, test and deploy. I decided to take a look at the percentage of overall time spent on broad work categories in the whole project, and that’s what this post is about.
First I had to get the data on time spent and break it down by work type. This was pretty straight forward for the “Supplier” side (mostly me and a business analyst) as we had detailed timesheet reports. For the customer side I had to do some educated guesstimation. This is how the overall picture came out with explanations below.
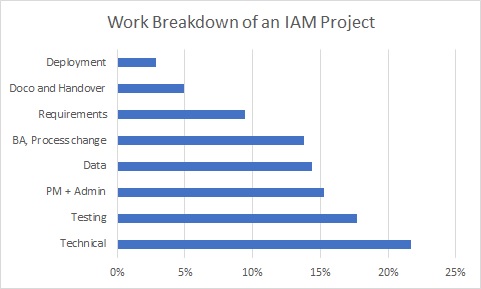
Technical – 22%
The solution development and configuration is maybe 60% of this overall figure. The rest is server builds, development of components in both source and target systems to support the solution, and all the myriad of other requests to technical teams including network, AD, database, software distribution, solution monitoring…
Testing – 18%
I had pretty good stats for this because the project employed a full-time tester for 5 months. In addition I’ve assigned 20% of my overall development time to my own unit testing, and helping the tester.
I have long suspected that testing time should be roughly equivalent to development time in an IAM project. Once you break down all the user categories, lifecycle events and target systems you will have a long list of scenarios to test. And then of course there’s the re-testing as we must expect multiple bug-fix/re-deploy/re-test cycles. Additionally it’s rare to find a tester with experince testing an IAM solution so a degree of orientation and learning is necessary.
As the “Technical” category above is a combination of development and other technical work, I think it’s fair to say that, on this project, testing took longer than development!
Project Management – 15%
This one was also pretty straight-forward to estimate as the customer PM was 50% on the project for the entire time. Some weeks less, some weeks a lot more – but it probably averaged out.
I think the PM load can be high in IAM projects, particularly in the key areas where engagement with other teams is essential – significantly process change and data cleaning; and also importantly, requirements scoping and deployment planning.
I also think that, where a supplier is brought in to design and build the solution, often including project management as part of the delivery, a strong PM on the customer side is still needed. An IAM project always impacts multiple areas of the business, and not just IT – other teams may have to make changes to their processes, provide data or resources, or contribute in other ways. An internal PM will, hopefully, know who to call and when to escalate, and command a higher level of trust than an “outsider”.
Data – 14%
This “Data” category incorporates identification of existing accounts (joins), identifying missing and incorrect data, and data cleansing. This is a classic “length of a piece of string” category – you really cannot accurately estimate the time needed without actually doing the work.
Where existing identity data-driven automation already exists in the environment your data-related workload may be low. Where management has been largely done by hand, you’re going to be in for some measure of pain.
The other factor to consider is whether the identified data sources are already used to drive automation outside their own system. This is critical, as we may be imposing expectations on both the data and the data management practices that did not previously exist.
Finally IAM solutions look at all the data. I’ve lost count of the times I’ve been told “yes we used to do all sorts of dodgy things, but since X project last year everything is ship-shape” – where what they actually mean is “everyone on-boarded in the last year should be ok – but before that, anyone’s guess”!
BA and Process Change – 14%
This figure is probably on the high side as this was a public sector customer. The public service, with its remit to provide services fairly and transparently using public money, has no choice but to be very process-oriented. Automation can only work when it goes hand in hand with process changes that both support the solution, and make effective use of it – but these process changes must be researched, discussed, proposed, discussed some more, documented, reviewed, implemented, reminded, enforced… The time estimate here covers my BA colleague’s time over the project, doubled to incorporate customer involvement across multiple teams.
Requirements – 9%
While we’re getting into the lower end of the percentages this still represented a large amount of effort – in fact the first two months of the project was mostly about requirements and scoping, including a portion of the BA work listed above.
I’ve written before about the importance of requirements and have no time for people who think that requirements are something you get in a meeting or an email, which you then “validate” over a couple of days. The more work that is spent on documenting and agreeing detailed solution requirements at the start of the project, the more smoothly the rest of the project will go.
Documentation and Handover – 5%
I don’t actually log documentation as a separate time code because I consider it to be part of development, and am pretty much working on the Design, Operations and Deployment documents throughout the whole process. I split out 10% of my development time to documentation for this estimate, though I have a feeling it may actually be higher.
I did have some clear stats on handover as I delivered training sessions to Service Desk, Desktop Support and the Server team, as well as informal handover to the day-to-day MIM administrator.
Deployment – 3%
This stat only really covers Production deployment, but does include deployment planning and meetings. There were a number of activities involving source and target systems that had to be co-ordinated with the MIM go-live date, so this did involve careful planning.
In Conclusion
While these stats only represent a single project, and I have had to estimate the customer work effort, I do think it provides an interesting picture. It shows the importance of requirements and analysis, and that data issues can be a huge part of the overall work effort. While we are delivering a technical solution, the actual technical work is just a part of it, and the solution would never make its way into production without testing, cajoling, pleading, insisting, reminding, analysing, explaining, demonstrating, documenting, reviewing and accepting.
It would be interesting to see comparable breakdowns other projects of varying sizes and scope – anyone got one?
Hi Carol
Very good post. I always say the Technical part is the easy part of a project, its all the other shenanigans that actually consume a lot of time and effort. That is why when people say oh this will take you just 2hrs to do, I chuckle to my self, Yeah, in my lab! But when you factor in project and organization overhead, imperfect data and requirements gathering (asking the right questions), that 2hrs can become 20hrs easily.
Experienced consultants know how to give a truly realistic scoping estimate so that we get minimal change requests during the project.
Ike